Soccer Analytics
Allsvenskan 2021
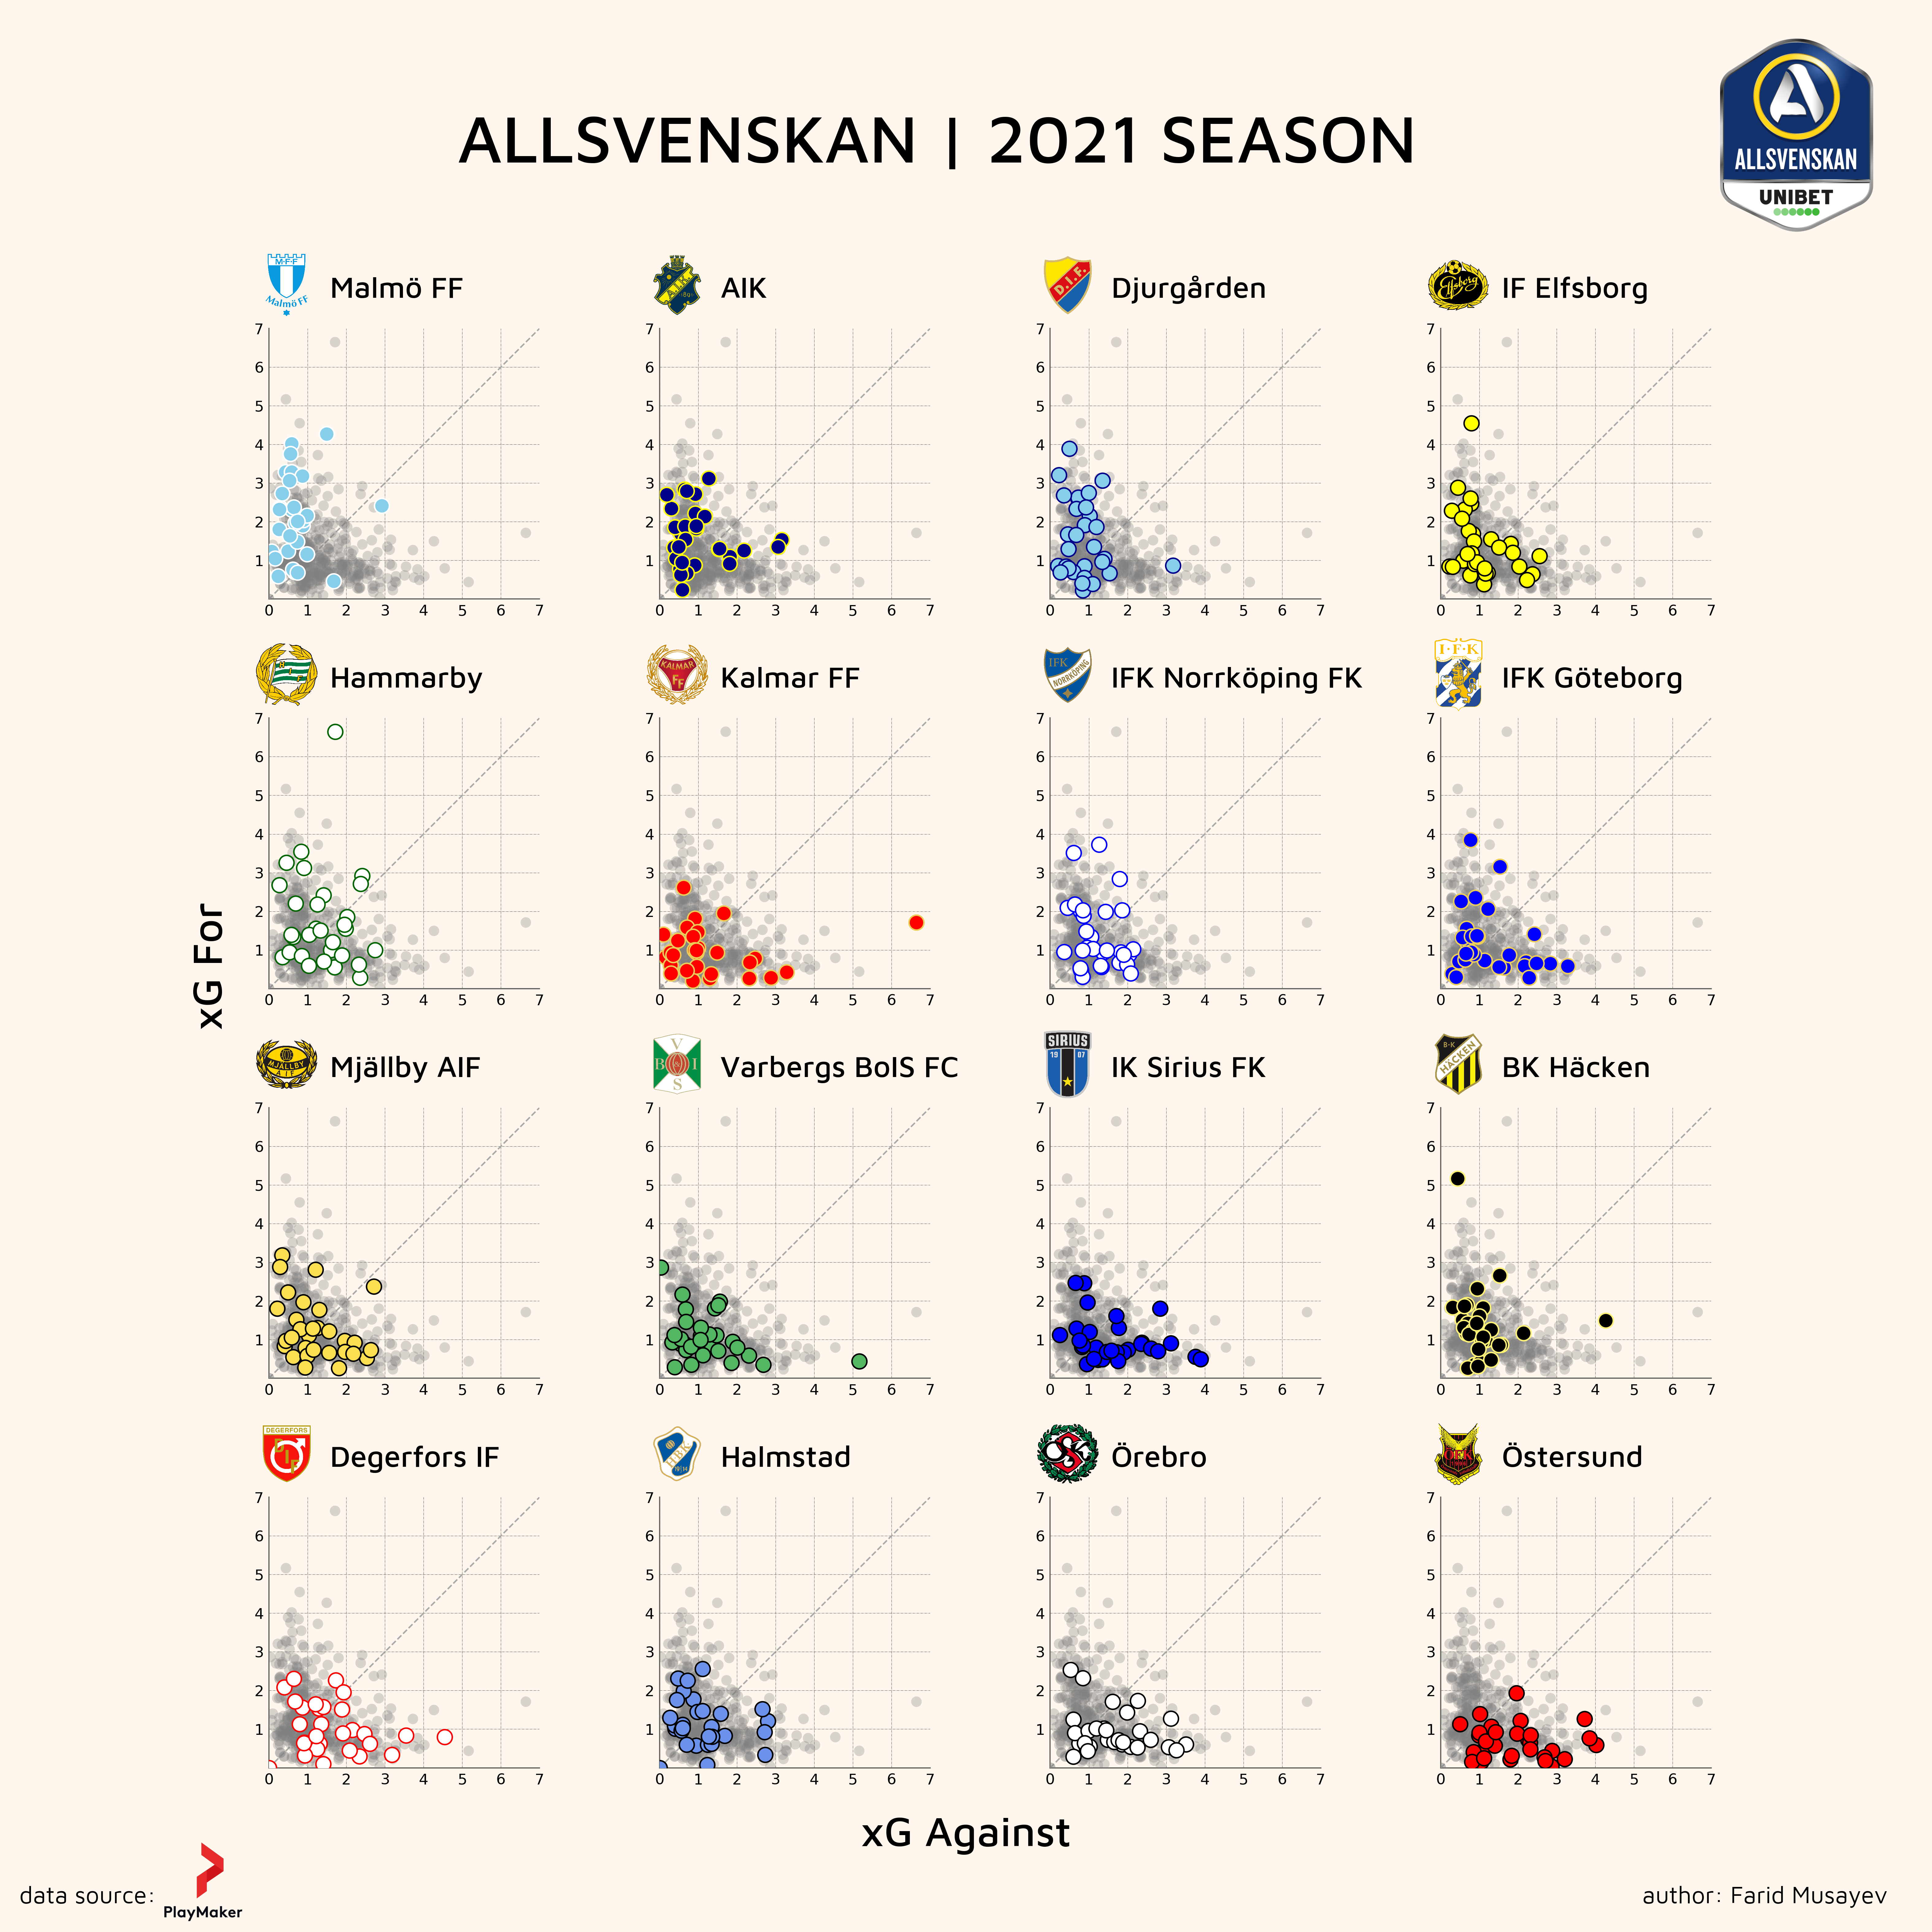
In this visualization, I make a gridplot of xG values conceded and scored by each team against all other teams in Allsvenskan (Swedish Top Football League) during season 2021. Since this is a gridplot, one can obtain only a general performance overview for each team. This gridplot was designed using object-oriented plotting in matplotlib.
Code is available here.

To view this plot in a high resolution, please follow this link.
Expected Threat model
In this article, I step by step demonstrate how to build a simple Expected Threat (xT) model.